


Mastering the Art of Balance Sheet Analysis
The biggest losses in stocks come from companies with poor balance sheets.’’ - Peter Lynch.

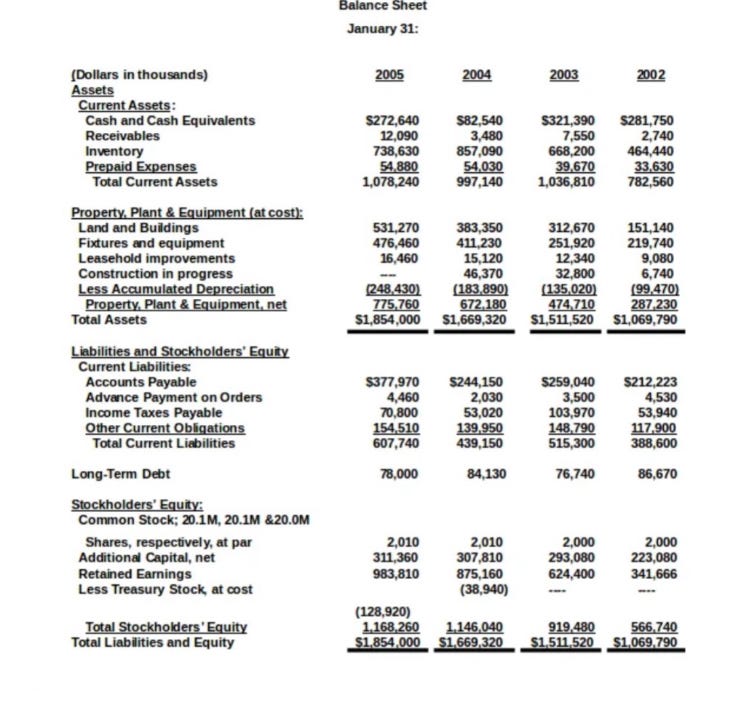
How To Analyze Balance Sheets.
Whenever you are analyzing a company, you should always be looking at their balance sheets.
For those who don’t know, a balance sheet is a financial statement of the assets, liabilities, and capital of a business.
Time and time again, I see people making the same mistake of not looking at balance sheets, and I think this quote summarizes exactly why they are so important:
‘’Never invest in a company without understanding its finances. The biggest losses in stocks come from companies with poor balance sheets.’’ - Peter Lynch.
A balance sheet gives us a snapshot of where a company stands at a given moment; it is for a given date (e.g. 14/04/2024) and not for a period in time (e.g. 01 January- 01 April).
The problem with balance sheets is that most people think they know how to analyze them, but the truth is most people don’t. That’s why I’ll be doing an in-depth analysis of how to interpret balance sheets.
What Makes Up a Balance Sheet:
Before diving into analysis, we need to understand the components that makeup balance sheets.:
1. Assets:
An asset is anything that is owned by the company and holds an inherent, quantifiable value.
These are made up of two sub - categories.
Current Assets:
These assets can be liquidated (turned to cash) within 12 months, and they include.
a. Cash and Cash Equivalents
This represents the value of the company’s assets that are in cash or that can be converted to cash in a short period of time (i.e. 90 days). The intelligent investor should look for businesses with healthy levels of cash as this is an indication of good economics. However, a business should not unnecessarily hoard up piles of cash, this cash should be returned to shareholders via dividends or buybacks.
b. Short Term Investments/ Marketable Securities
These are unrestricted investments the company holds that can be easily bought, sold or traded on public exchanges. The intelligent investor should evaluate whether the company’s capital is being allocated to high-risk securities or any unaligned businesses. During the crypto boom, it was common to see companies take shareholder money and invest it into risky and speculative cryptocurrencies.
c. Net Receivables
This is the amount of money that is owed to the business by its customers for goods sold or services rendered. Businesses with no moats tend to give lax payment terms to boost sales (e.g. they can require payments in 60 days rather than the standard 30 days)- this will result in an increase in sales and an increase in receivables. If a company shows a lower percentage of net receivables to gross sales than its competitors, this can be an indication of a competitive advantage. This means the businesses customers are either paying up front or the business is not offering lax payment terms.
d. Inventory
These are goods held by the company for sale or production. The intelligent investor should examine the inventory turnover ratio of a company. A high inventory turnover ratio indicates that a company effectively sells its inventory and thus minimizes carrying costs and obsolescence risks. The intelligent investor should also be aware that certain businesses run the risk of their inventories becoming obsolete (e.g. fast fashion – Shein) and the intelligent investor should avoid such businesses.
Inventory Turnover Ratio = Inventory/ COGS
e. Prepaid Expenses
This represents payments the company has made for goods or services they will receive in the future. This can be an indication of good financial planning but ballooning prepaid expenses can indicate aggressive accounting practices or a lack of operational efficiency.
Non-Current Assets:
These assets cannot be liquidated in 12 months, and they include:
a. PP&E
This represents the value of a business’s tangible assets such as land, buildings, machinery, and equipment. These assets are carried at original cost less the accumulated depreciation. If a business is in an ever changing or highly competitive industry, they will need to constantly upgrade their PP&E and this will eat away at earnings and hence shareholder returns.
b. Goodwill
Whenever a company buys another and pays in excess of book value, that excess is recorded under the heading Goodwill. Goodwill is not amortized or depreciated; it is however periodically tested for impairment. The intelligent investor should closely dissect goodwill as excessively high goodwill relative to tangible assets can suggest a history of overpayment for acquisitions.
c. Intangibles
These are non-tangible assets (e.g. patents, copyrights, trademarks) that a company holds. The intelligent investor should assess the durability of these assets. If one is to invest into a pharmaceutical company, is it imperative that they look at how many patents the company holds and how long those patents will be valid for.
A company cannot recognize internally generated intangible assets, they can only recognize intangible assets acquired from a third party. The Coke brand is probably worth hundreds of billions, but because it is internally developed, it can not be recognized on the balance sheet.
d. Long Term Investments
These are investments such as equity or debt securities that the company intends to hold for an extended period.
These investments are carried at cost and thus can’t be marked up even if the investment has appreciated in value.
2. Liabilities:
Liabilities are obligations that a company has to external parties as a result of past transactions/ events.
These are also made up of two sub - categories.
Current Liabilities:
They are debts which are due within 12 months. These include:
a. Accrued Expenses
This represents the costs that have been incurred but not yet paid. This includes salaries and wages payable.
b. Accounts Payable
This represents the amount of money owed by a company to its suppliers for good or services purchased on credit.
c. Short Term Debt
This represents debt that is due for repayment within a year. Excessive reliance on short term debt to finance operations may indicate financial vulnerability.
d. Long Term Debt Due
Non-Current Liabilities:
They are Debts due beyond 12 months. These include:
a. Long Term Debt
This represents debt that matures in over a years’ time. The amount of long-term debt a company carries gives us an insight into its economics. A company with a moat will not need to fund its operations using debt and will generate enough cash internally to fund its operations and growth. If a company excessively relies on debt that can be an indication of poor economics
Companies with a moat typically have sufficient yearly net earnings to pay off all its long-term debt within 3 to 4 years.
b. Deferred Income Tax
c. Minority Interest
Whenever a company acquires more than 80% of the stock of another- it can shift the acquiree’s balance sheet and income statement onto its own balance sheet and income statement. So, the minority interest represents the percentage of stock the company doesn’t own.
That is if Company A acquires 85% of Company B, the minority interest is the 15% of Company B that Company A doesn’t own.
d. Other Liabilities
3. Shareholders Equity
This represents the company’s worth and what shareholders would receive if the company were sold and debts cleared.
This is Calculated as Total Assets - Total Liabilities.
It includes:
a. Preferred Stock
Preferred stock represents ownership in a company with preferential rights over common stock, typically in terms of dividends and liquidation preferences.
b. Common Stock
Common stock represents ownership in a company with voting rights and residual claim on assets and earnings after preferred stockholders and debt holders.
c. Treasury Stock
This represents a company’s own shares which it has bought back. We want to see this basket every increasing as this means that the company is actively buying back stock and hence our ownership percentage in the business is ever increasing.
I have a post where I go in depth in analyzing stock buybacks- Analyzing Stock Buybacks
d. Retained Earnings
Retained earnings are the accumulated portion of a businesses profits that are not distributed as dividends to shareholders but instead are reserved for reinvestment back into the business.
Even though we would like to see thus basket increasing, a company should not aimlessly retain earnings. A company should only retain earnings if every $1 of retained earnings translates into at least $1 of market value over time.
Calculations
Debt to Shareholders Equity Ratio
=total liabilities/ shareholders equity
This ratio gives us insight into a company’s capital structure, is the company financed more by debt or by equity. The lower the better.
Current Ratio
This is a liquidity ration which measure the ability of a company to meet its short term obligations
Current Ratio= Current Assets/ Current Liabilities
>1 : Good (Business can meet short term obligations)
<1 : Bad ( Business can struggle to meet short term obligations)
Inventory Turnover Ratio
High inventory turnover ratio indicates that a company effectively sells its inventory and thus minimizes carrying costs and obsolescence risks
Inventory Turnover Ratio = Inventory/ COGS
Buffett’s $1 Test
A business should not aimlessly retain earnings. A company should only retain earnings if every $1 of retained earnings translates into at least $1 of market value over time.
I have a post that goes in detail on Warren Buffett’s $1 Test- Buffett's $1 Test
That’s all for today. Don’t forget to like and share the comment. Willing to answer any questions in the comments
Thank you.
great 101 take, cheers!